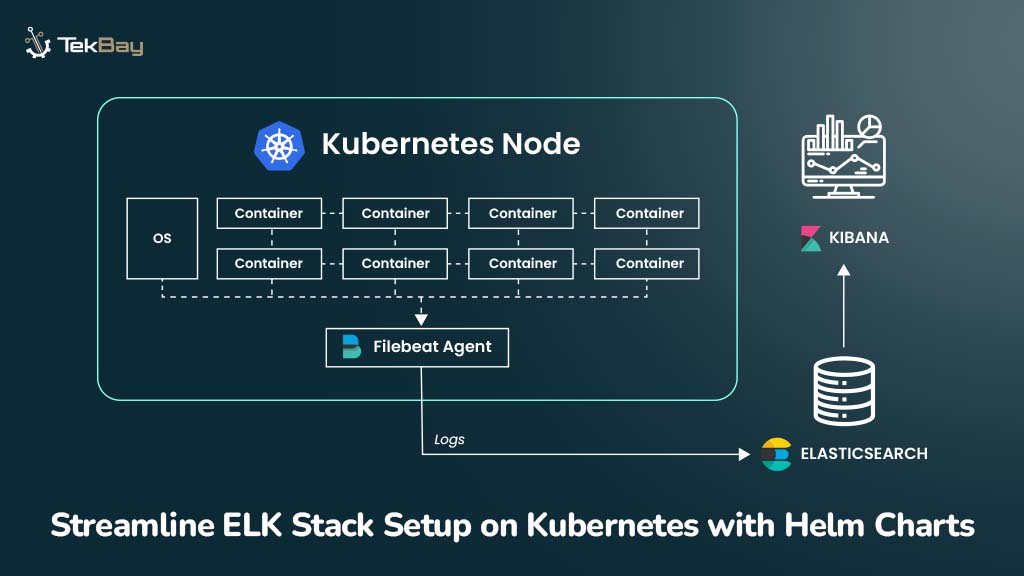
ELK Stack (Elasticsearch, Logstash, Kibana) is a log aggregation, storage, and visualization toolkit that, when deployed on Kubernetes, offers enhanced logging and monitoring capabilities.
However, deploying and maintaining these tools together can be daunting without a streamlined deployment process. So, integrating Helm charts offers a practical solution to ease this complexity.
Helm charts use pre-configured packages, making deploying and managing the ELK Stack on Kubernetes easier, saving time, and reducing unproductive workloads.
This blog post will guide you through a step-by-step procedure to deploy the ELK Stack and Filebeat in a Kubernetes environment using Helm.
Why Should You Deploy ELK Stack on Kubernetes with Helm?
Adding tools like Kubernetes and Helm to your ELK Stack is like upgrading to an automatic transmission in a car — it makes everything run more smoothly and efficiently.
Its benefits include:
- Effortless Scaling: Automatically adjust ELK Stack components based on resource demand.
- Faster Deployments: Helm charts speed up the deployment process, reducing manual configurations and errors.
- Easy Rollbacks: Helm’s version control feature makes it easy to revert to previous configurations when needed, ensuring stability.
- Optimized Resource Usage: Efficiently allocate CPU, memory, and storage across the ELK Stack, ensuring optimal performance and resource management.
Prerequisites
Before proceeding with the ELK Stack setup, ensure you have the following prerequisites in place:
- A running Kubernetes cluster.
kubectl:Installed and configured to interact with your Kubernetes cluster.- Helm: A package manager for Kubernetes, installed and configured.
- OpenLens: A visual tool to interact with Kubernetes clusters and manage configurations.
Procedure
Before proceeding, ensure the necessary namespace for the ELK Stack is created using the kubectl command. In this guide, we’ll be utilizing an AWS EKS Cluster to deploy the ELK Stack.
Step 1: Configuring Kubernetes and Helm Repositories
1.1 Update kubeconfig for AWS EKS Cluster
To begin, update the kubeconfig file for your EKS cluster to configure your Kubernetes connection and enable local communication using the kubectl CLI command:
aws eks update-kubeconfig --name --region 1.2 Create the Necessary Kubernetes Namespace
Use the kubectl command to create the necessary namespace for deploying the ELK Stack after updating the kubeconfig file.
kubectl create ns 1.3 Add Helm Repositories
The next step is to add the Elastic Helm repository, which provides charts for Elasticsearch, Kibana, Logstash, and Filebeat. These charts simplify the deployment and management of the ELK Stack components in Kubernetes.
Before proceeding, ensure Helm is installed on your local machine. If not, you can refer to the official Helm installation guide.
Add the Elastic Helm repository and search for the relevant charts:
helm repo add elastic https://helm.elastic.co
helm search repo elastic
We will be working on the following repositories:
elastic/elasticsearchelastic/filebeatelastic/kibanaelastic/logstash
Step 2: Setting Up Elasticsearch in Kubernetes
Elasticsearch is a distributed search and analytics engine that allows you to search, index, store, and analyze data in near real-time.
A critical aspect of setting up Elasticsearch in Kubernetes is ensuring its data remains persistent.
2.1 Configure Elasticsearch with Helm
Create a configuration file elasticsearch.yml with the following:
---
fullnameOverride: infix-shared-elasticsearch
replicas: 1
minimumMasterNodes: 1
volumeClaimTemplate:
  accessModes: ["ReadWriteOnce"]
  resources:
    requests:
      storage: 10Gi
Deploy Elasticsearch using the following Helm command:
helm upgrade --install elk-elasticsearch elastic/elasticsearch -n elk -f elasticsearch.ymlActual Command:
helm upgrade --install elastic/elasticsearch -n -f
For more details on the Elasticsearch Helm chart, including version information and advanced configuration options, refer to the Artifact Hub Elasticsearch Helm chart.
Step 3: Setting Up Kibana for Log Visualization
Kibana is a data visualization and exploration tool for monitoring log and time-series analytics applications stored in Elasticsearch.
3.1 Configure Kibana with Helm
Create a file named kibana.yml and add the below content to the file:
---
fullnameOverride: infix-shared-kibana
elasticsearchHosts: "https://infix-shared-elasticsearch:9200"
elasticsearchCertificateSecret: infix-shared-elasticsearch-certs
elasticsearchCertificateAuthoritiesFile: ca.crt
elasticsearchCredentialSecret: infix-shared-elasticsearch-credentials
ingress:
  enabled: true
  className:
  annotations:
    nginx.ingress.kubernetes.io/enable-cors: "true"
    nginx.ingress.kubernetes.io/cors-allow-origin: ""
    cert-manager.io/cluster-issuer:
    acme.cert-manager.io/http01-edit-in-place: "true"
  hosts:
    - host:
      paths:
        - path: /
  tls:
    - hosts:
        -
      secretName:
3.2 Deploy Kibana with Helm
After creating the configuration file, deploy Kibana using Helm with the following command:
helm upgrade --install elk-kibana elastic/kibana -f kibana.yml -n elkNote: Before deploying Kibana, confirm that the Helm chart is correctly set up in your environment. You can refer to the Elastic Kibana Helm Chart for additional details about the chart’s configuration and capabilities.
3.3 Address Ingress Dependencies
While deploying Kibana, we are also implementing the concept of Ingress. For this, we have some resource dependencies that you must have created before deploying the ELK stack.
- ClusterIssuer: Manages the issuance of TLS certificates in Kubernetes.
- IngressClass: Defines the ingress controller used for routing requests to Kibana.
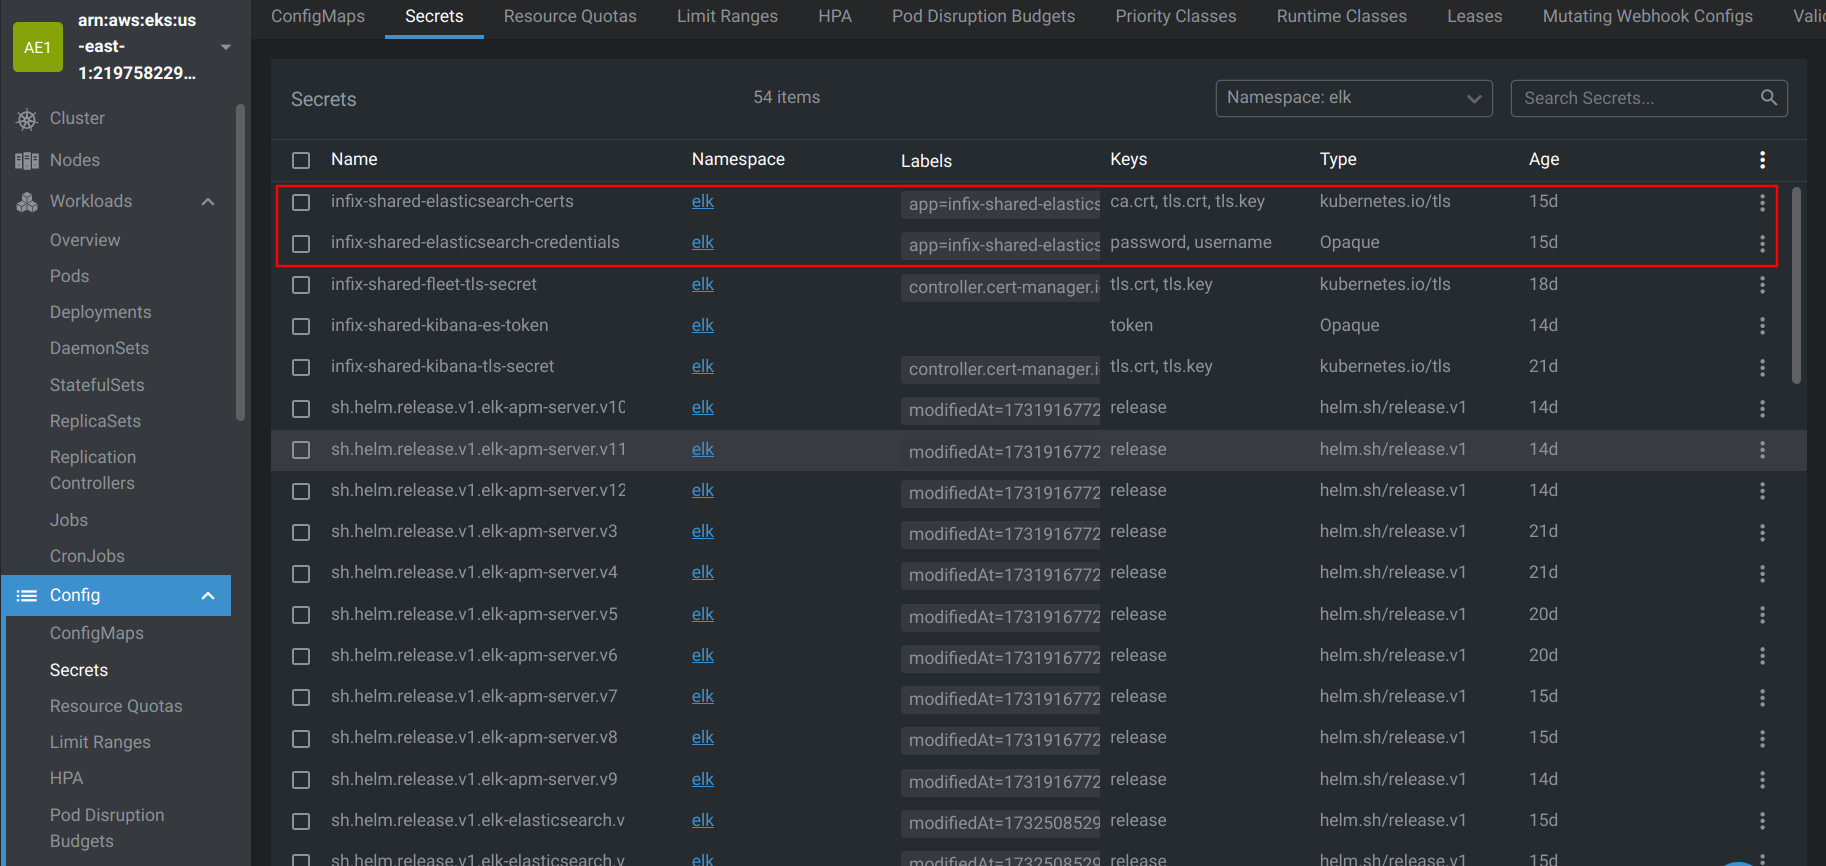
3.4 Verify Elasticsearch Secrets Using OpenLens
To ensure Kibana connects to Elasticsearch successfully, verify the Elasticsearch secrets referenced in the configuration.
Use OpenLens to inspect the secrets, as shown below:
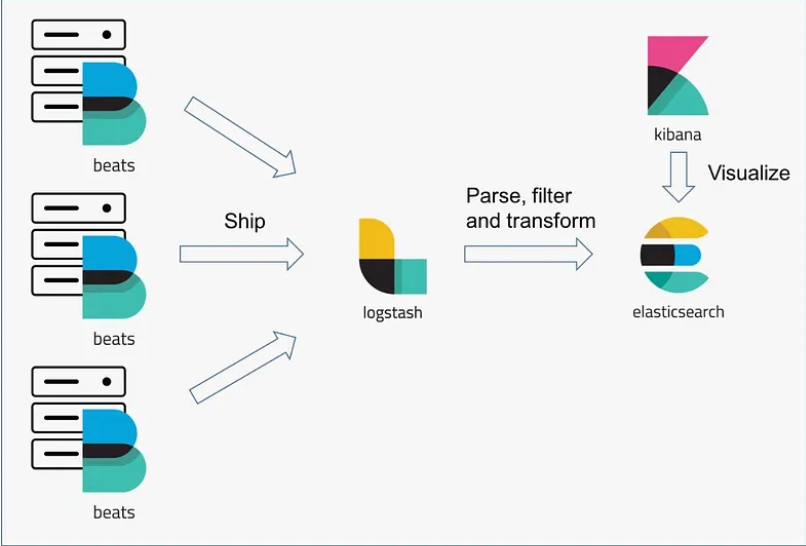
Step 4: Setting Up Logstash for Data Ingestion
Logstash is an open-source data collection engine with real-time pipelining capabilities. It can dynamically unify data from disparate sources and normalize it to destinations of your choice.
4.1 Configure Logstash with Helm
Create a configuration file logstash.yml to specify the Logstash pipeline:
# Logstash
---
fullnameOverride: infix-shared-logstash
persistence:
  enabled: true

logstashConfig:
  logstash.yml: |
    http.host: 0.0.0.0
    xpack.monitoring.enabled: false

logstashPipeline:
 logstash.conf: |
    input {
      beats {
        port => 5044
      }
    }
    output {
      elasticsearch {
        hosts => "https://infix-shared-elasticsearch:9200"
        ssl_certificate_verification => false
        manage_template => false
        index => "%{[@metadata][beat]}-%{+YYYY.MM.dd}"
        document_type => "%{[@metadata][type]}"
        user => "elastic"
        password => "${ELASTICSEARCH_PASSWORD}"
      }
    }

service:
  type: ClusterIP
  ports:
    - name: beats
      port: 5044
      protocol: TCP
      targetPort: 5044
    - name: http
      port: 8080
      protocol: TCP
      targetPort: 8080

extraEnvs:
  - name: "ELASTICSEARCH_USERNAME"
    valueFrom:
      secretKeyRef:
        name: infix-shared-elasticsearch-credentials
        key: username
  - name: "ELASTICSEARCH_PASSWORD"
    valueFrom:
      secretKeyRef:
        name: infix-shared-elasticsearch-credentials
        key: password
4.2 Deploy Logstash using Helm
helm upgrade --install elk-logstash elastic/logstash -f logstash.yml -n elk
4.3 Pipeline Configuration for Logstash
- The username and password used in the output section of the Logstash pipeline are securely retrieved from the Kubernetes secrets created during the deployment of Elasticsearch and Kibana.
- The same username and password are used to log into the Kibana dashboard.
The Helm chart for Logstash is hosted on Elastic’s repository. Refer to the Elastic Logstash Helm Chart documentation for additional configuration options or troubleshooting.
Step 5: Setting Up Filebeat for Log Forwarding
Filebeat is a lightweight shipper for forwarding and centralizing log data. Installed as an agent on your servers, Filebeat monitors the log files or locations you specify, collects log events, and forwards them to Elasticsearch or Logstash for indexing.
5.1 Configure Filebeat with Helm
Create a file named filebeat.yml and add the following content:
---
fullnameOverride: infix-shared-filebeat
filebeatConfig:
  filebeat.yml: |
    filebeat.inputs:
    - type: container
      paths:
        - /var/log/containers/*.log
      processors:
      - add_kubernetes_metadata:
          host: ${NODE_NAME}
          matchers:
          - logs_path:
              logs_path: "/var/log/containers/"

    output.logstash:
      hosts: ["infix-shared-logstash:5044"]

secretMounts:
  - name: "elasticsearch-crets"
    secretName: "infix-shared-elasticsearch-certs"
    path: /usr/share/filebeat/certs/

extraEnvs:
  - name: "ELASTICSEARCH_USERNAME"
    valueFrom:
      secretKeyRef:
        name: infix-shared-elasticsearch-credentials
        key: username
  - name: "ELASTICSEARCH_PASSWORD"
    valueFrom:
      secretKeyRef:
        name: infix-shared-elasticsearch-credentials
        key: password
5.2 Deploying Filebeat
Run the following Helm command to install Filebeat:
helm upgrade --install elk-filebeat elastic/filebeat -f filebeat.yml -n elkThis command installs Filebeat into the elk namespace using the configuration file filebeat.yml.
For additional details, configurations, and advanced options, refer to the Elastic Filebeat Helm Chart documentation.
Configuring Kibana Access and Log Visualization Setup
After the ELK stack is successfully deployed, Kibana will be your central dashboard for log exploration, performance monitoring, and troubleshooting.
- Once you’ve configured the ingress, you can visit Kibana through the URL provided by your ingress service.
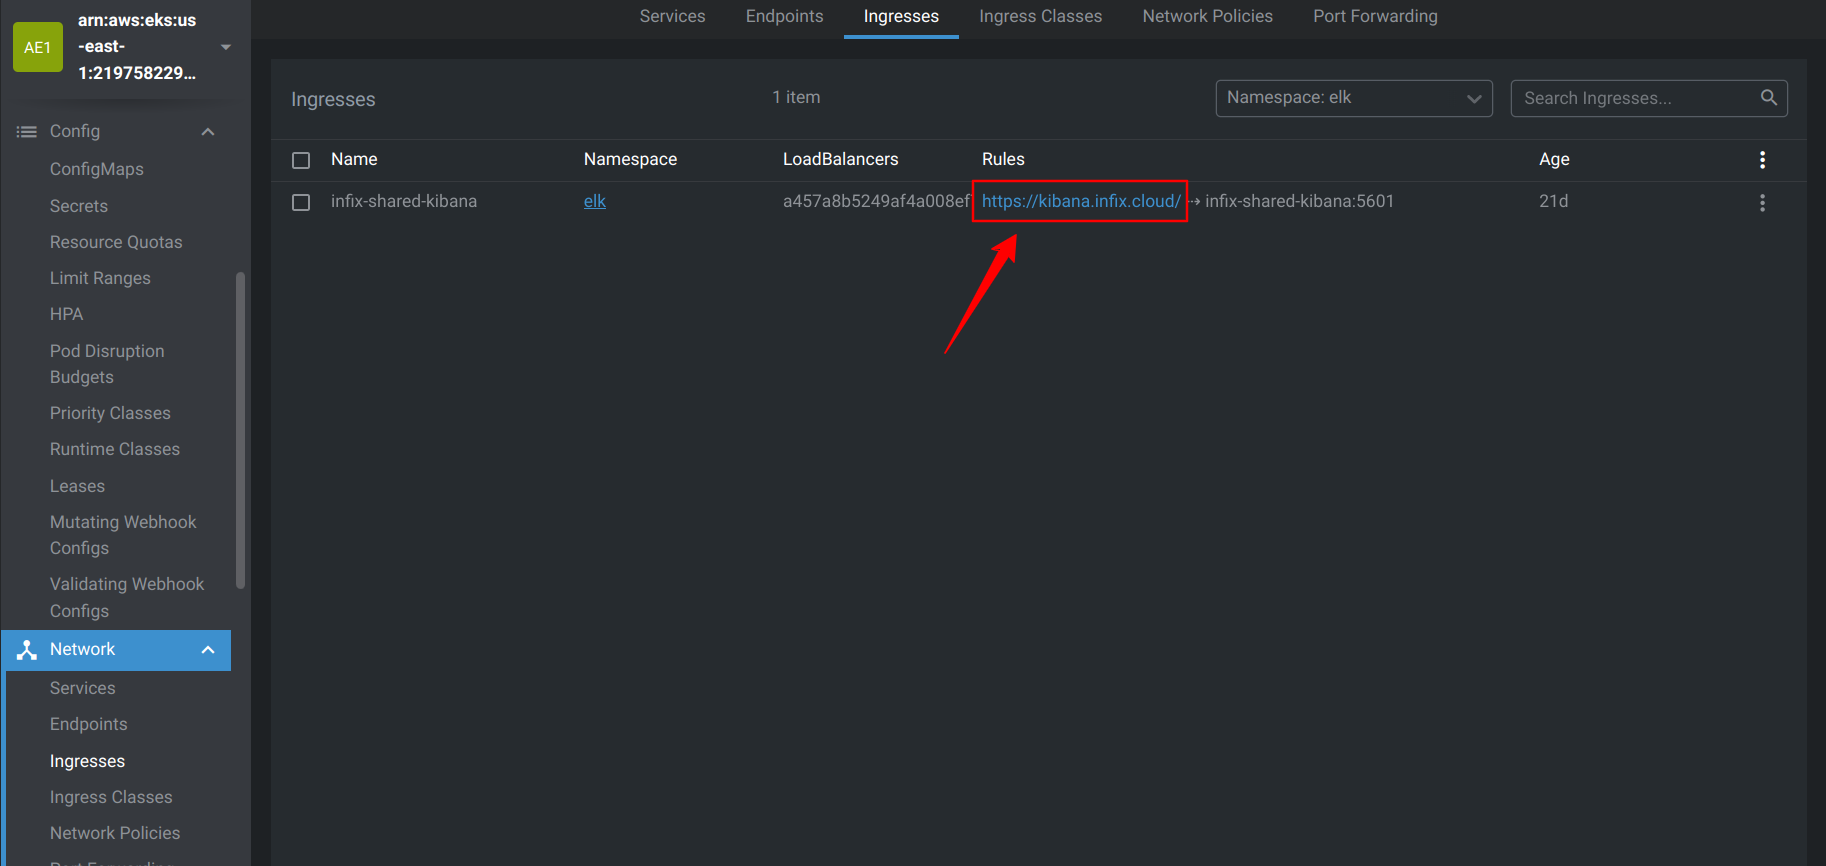
- After going through the link, we can view the Kibana dashboard for logging purposes.
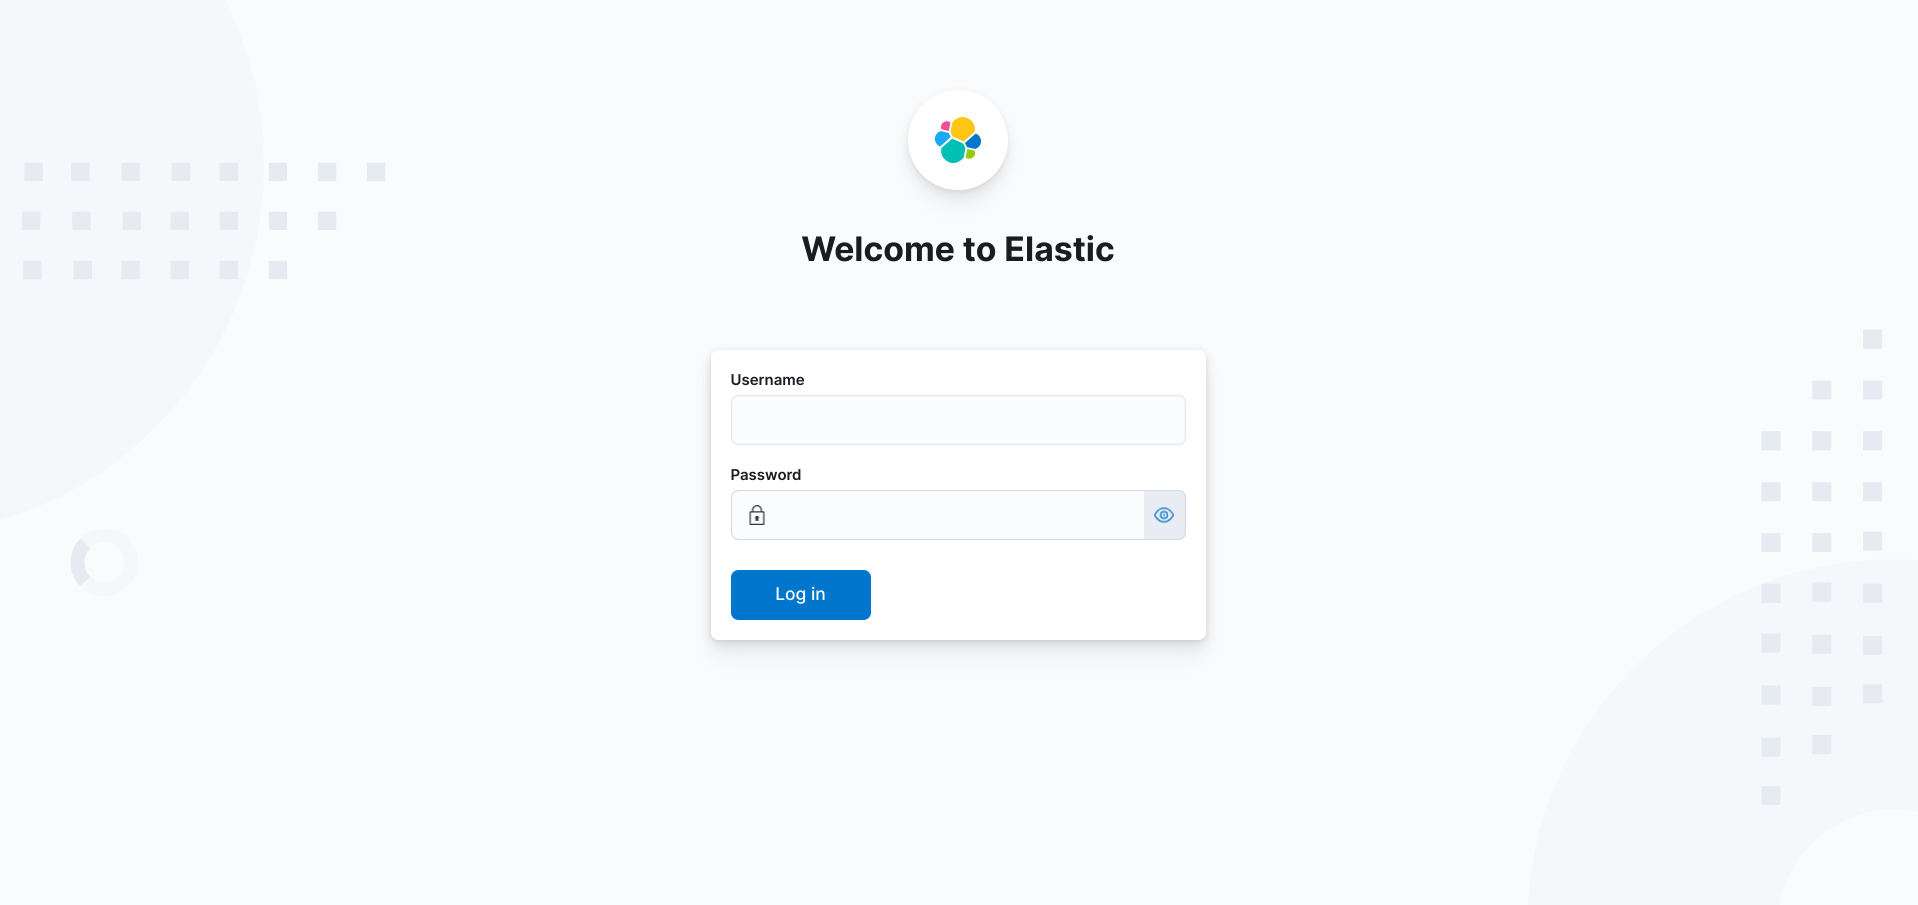
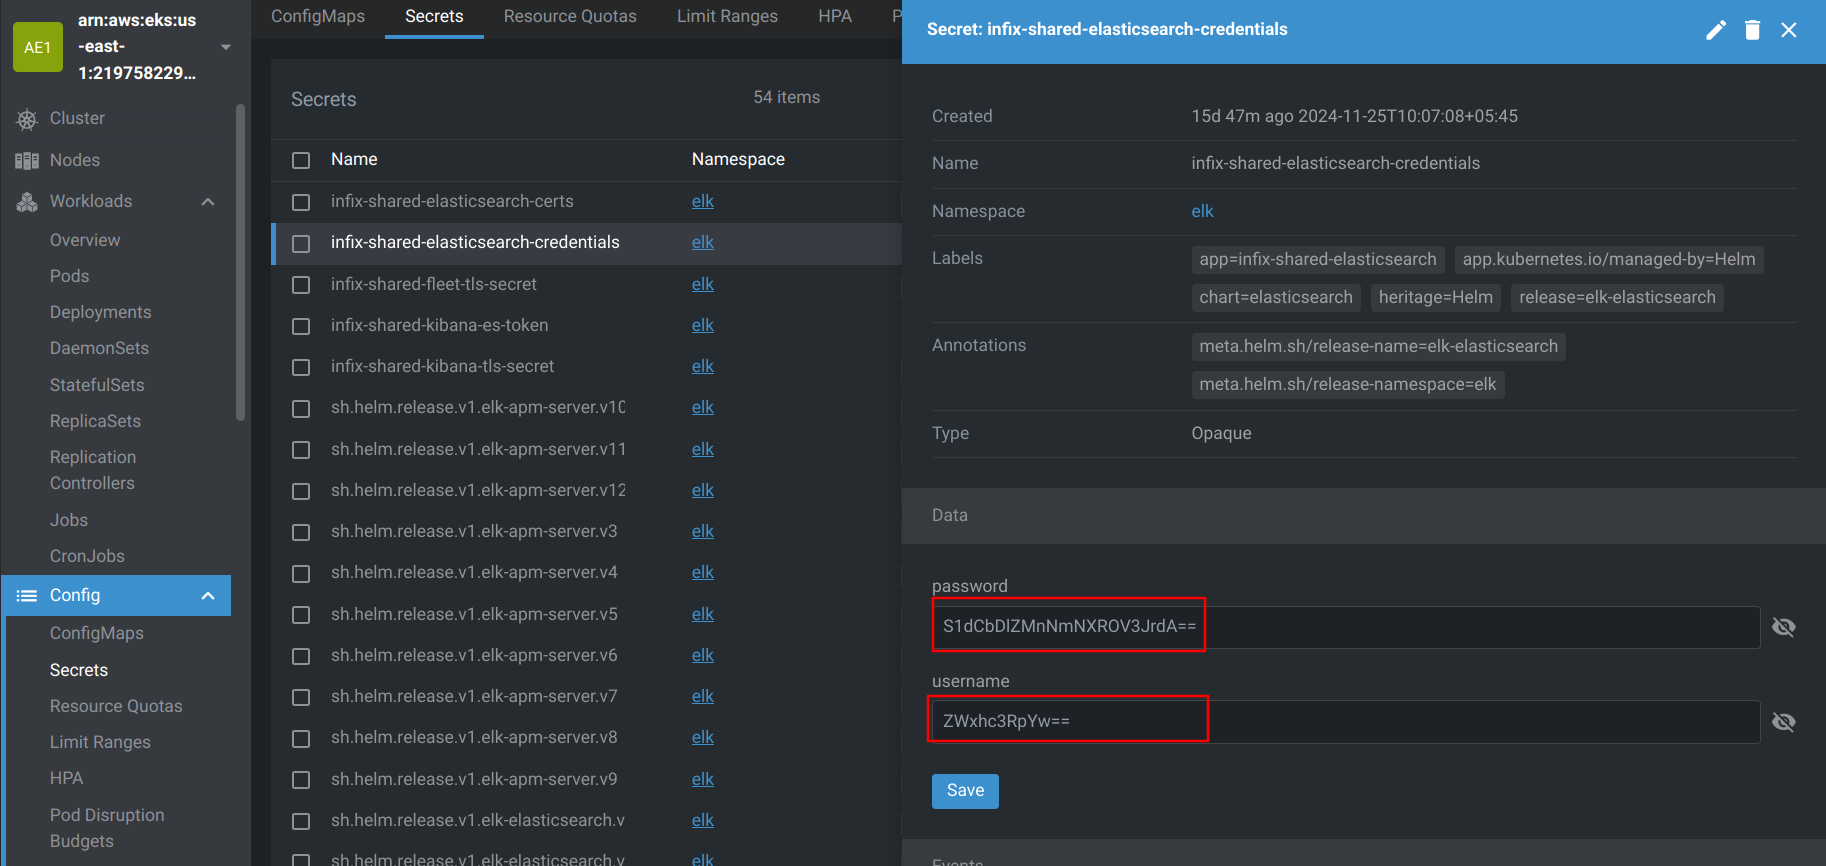
- Now that you’ve accessed the Kibana dashboard through the ingress URL, you can log in using the credentials stored in Kubernetes secrets.
- In your Kubernetes cluster, navigate to the secrets associated with Elasticsearch, specifically the infix-shared-elasticsearch-credentials secret. This secret contains the username and password necessary to log into Kibana.
- After logging in, you can start using Kibana to search, analyze, and visualize logs from your applications.
Conclusion
In this blog, we walked through the deployment of the ELK Stack—Elasticsearch, Logstash, Kibana, and Filebeat—using Helm charts in a Kubernetes cluster. This streamlined approach not only simplifies the setup process but also ensures scalability and ease of management for log aggregation and analysis.
By leveraging Helm, we can focus on optimizing the ELK Stack’s performance and configuration, leaving the deployment complexities to Kubernetes. Once your ELK Stack is up and running, you can harness its full potential for monitoring, troubleshooting, and gaining actionable insights from your log data.